Product Examples
The solutions we showcase here are only a sample of what we can offer. Our services are flexible and adaptable to your specific needs. If you have any ideas, challenges, or questions related to data and analytics reporting, we are ready to help. Contact us today and schedule a consultation. We will listen to your needs and propose a solution that suits your goals.
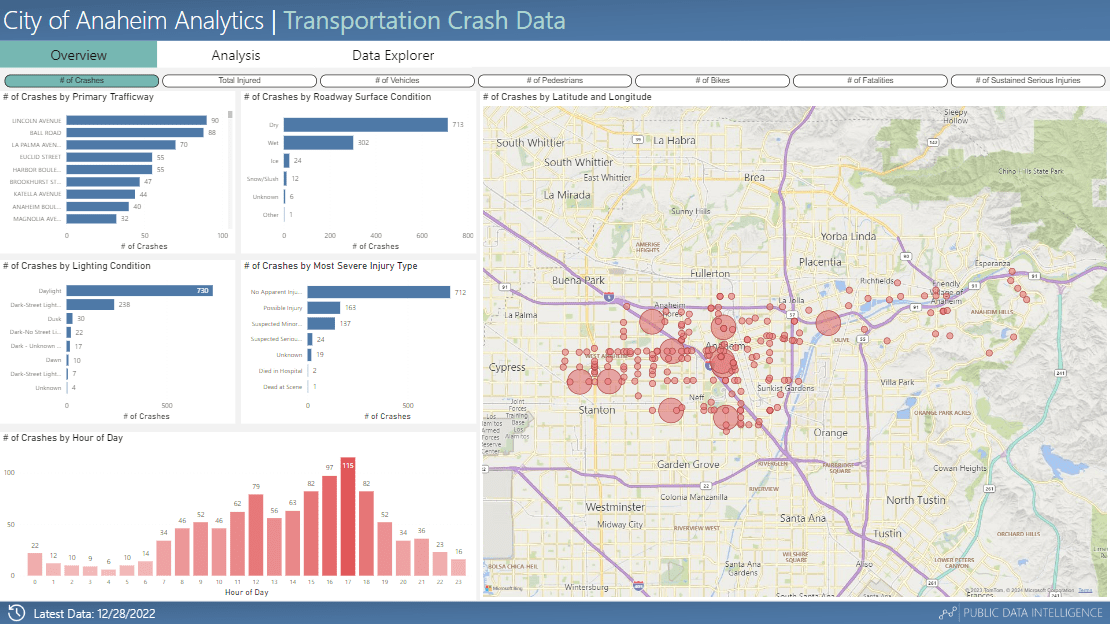
Crash Data
Summary
Our Power BI report for crash data and history is a tool that helps you monitor and analyze the traffic safety and mobility of your city. It shows you various metrics and indicators related to the crashes, such as severity, location, time, cause, and type. With our Power BI report, you can gain insights into the patterns, trends, and impacts of the crashes, and make informed decisions for the prevention and mitigation of traffic accidents.
Target Users
- Public Works Directors
- Transportation Leadership & Analysts
- Transporation Planners & Engineers
- General Public
- Grant Applicators
Key Performance Indicators
- Time and Day
- Crash Severity
- Location
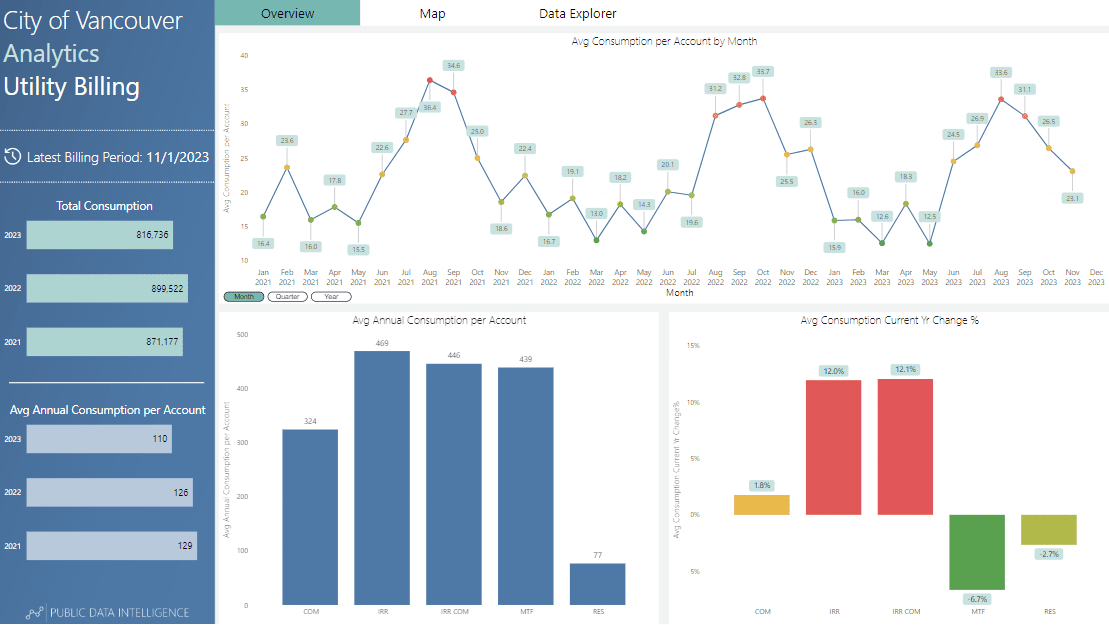
Water Consumption & Utility Billing
Summary
Our Power BI report for water consumption is a tool that helps you monitor and analyze the water usage of your city. It shows you various metrics and indicators related to the water consumption, such as average monthly consumption, consumption per account type, and consumption trends. This report can assist you with your water conservation efforts and goals.
Target Users
- Public Works Directors
- Finance Directors & Support Staff
- Utility Leadership & Analysts
- Capital Project Engineers & Managers
Key Performance Indicators
- Water Consumption
- Winter Average Activity for Sewer Utility Rates
- Location
- Outlier Detection
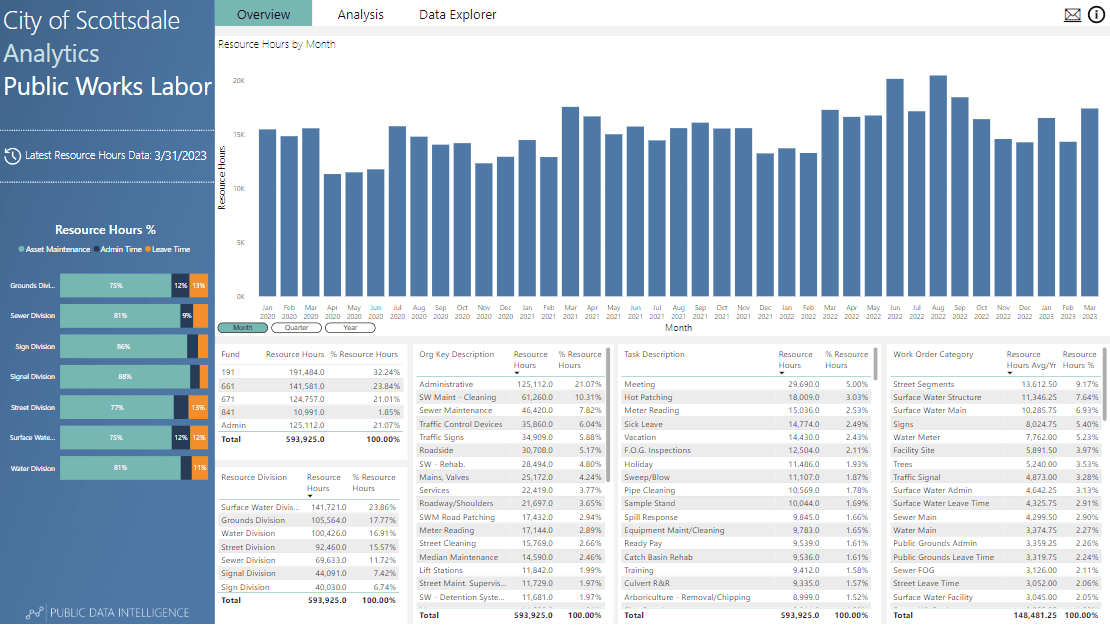
Public Works Maintenance Labor
Summary
Our Power BI report for Public Works maintenance labor activity is a tool that helps you manage and monitor your staff's time and effort. It shows you various metrics and indicators related to the labor hours, costs, and utilization of your workers, and allows you to filter, sort, and drill down the data by different criteria.
Target Users
- Public Works Directors
- Finance Directors & Support Staff
- Maintenance Leadership & Analysts
Key Performance Indicators
- Labor Hours
- Productive, Administrative, and Leave Time
- Historical Labor Hours Comparisons
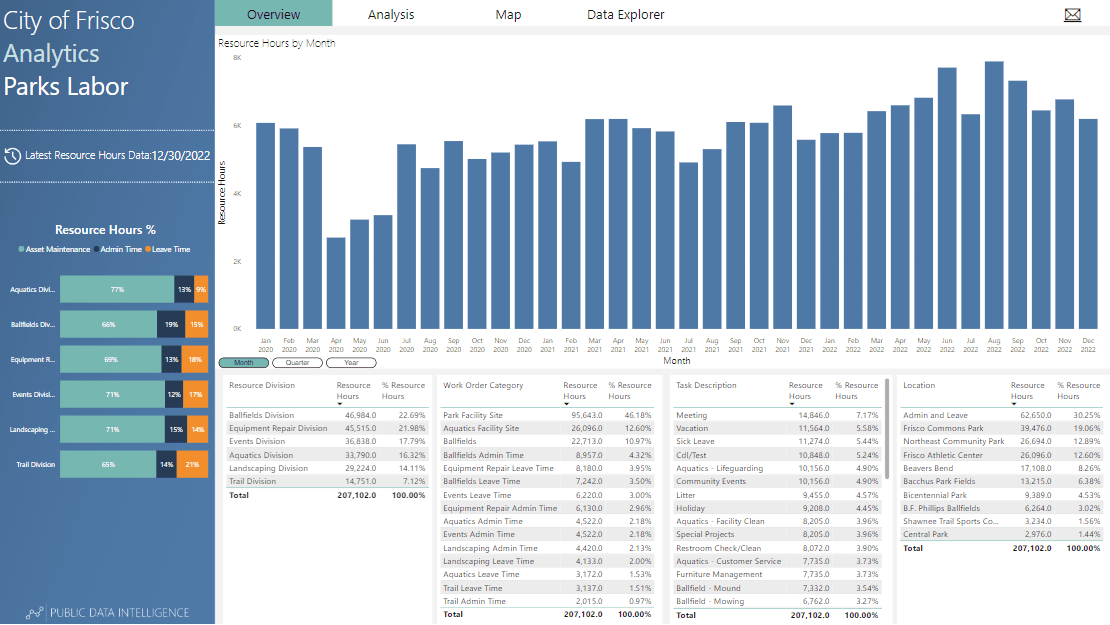
Parks Maintenance Labor
Summary
Our Power BI report for Parks maintenance labor activity is a tool that helps you manage and monitor your staff's time and effort. It shows you various metrics and indicators related to the labor hours, costs, and utilization of your workers, and allows you to filter, sort, and drill down the data by different criteria.
Target Users
- Parks Directors
- Finance Directors & Support Staff
- Maintenance Leadership & Analysts
Key Performance Indicators
- Labor Hours
- Productive, Administrative, and Leave Time
- Historical Labor Hours Comparisons
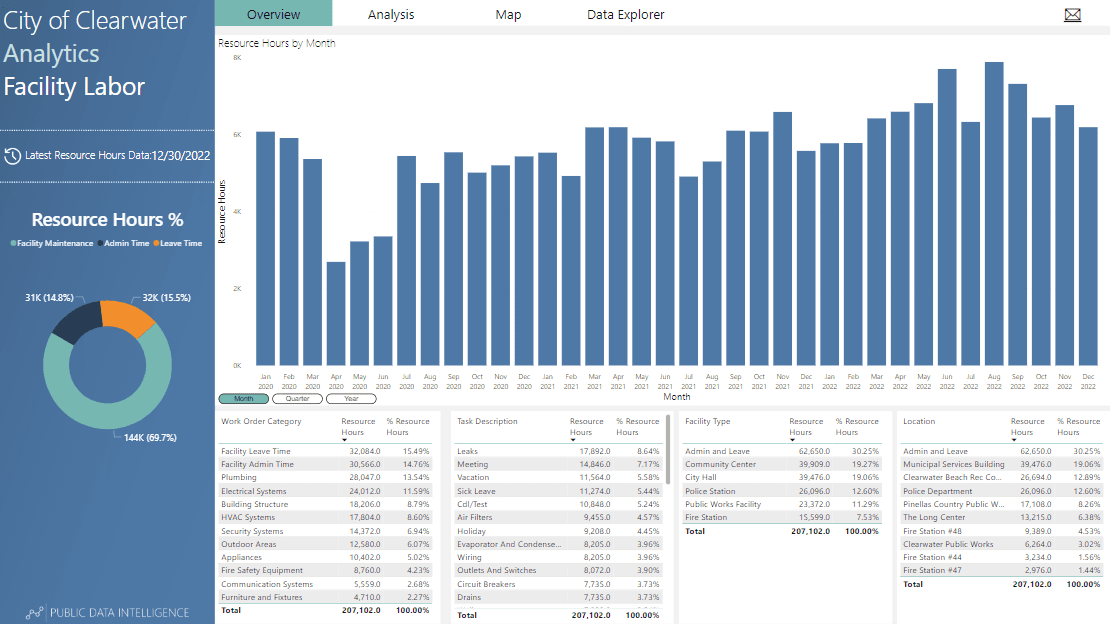
Facility Maintenance Labor
Summary
Our Power BI report for Facility maintenance labor activity is a tool that helps you manage and monitor your staff's time and effort. It shows you various metrics and indicators related to the labor hours, costs, and utilization of your workers, and allows you to filter, sort, and drill down the data by different criteria.
Target Users
- Facility Directors
- Finance Directors & Support Staff
- Maintenance Leadership & Analysts
Key Performance Indicators
- Labor Hours
- Productive, Administrative, and Leave Time
- Historical Labor Hours Comparisons
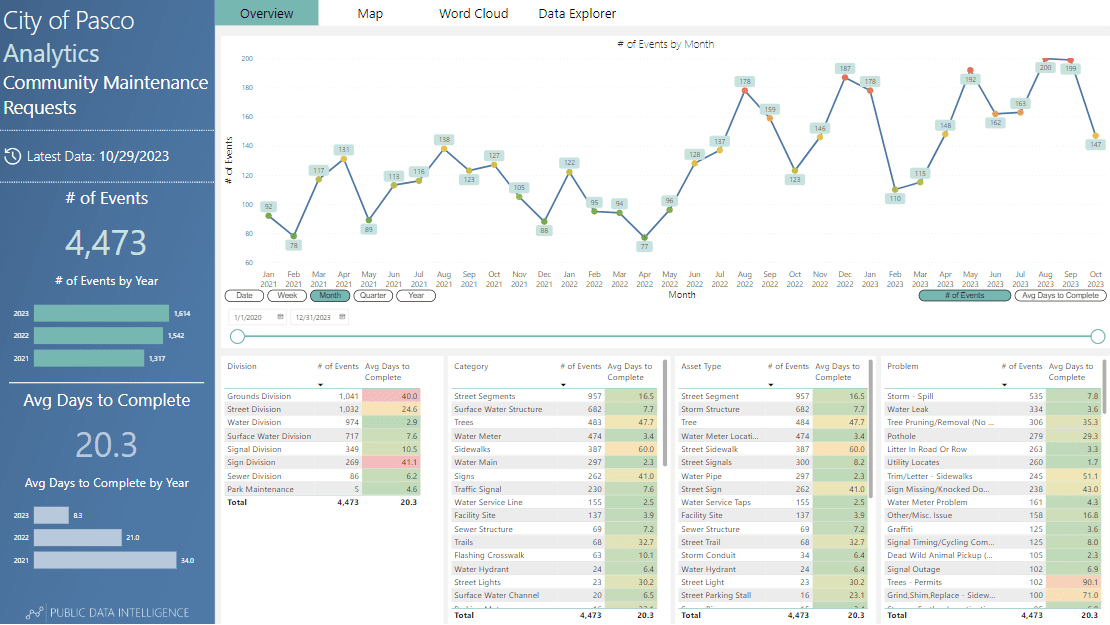
Community Maintenance Requests
Summary
Our Power BI report for community maintenance requests is a tool that helps you monitor and analyze the requests for various services, such as graffiti removal, tree pruning, flooding mitigation, and more. It shows you various metrics and indicators related to the requests, such as status, priority, type, location, and response time.
Target Users
- Public Works Directors
- Maintenance Leadership & Analysts
Key Performance Indicators
- Response Time
- Location
- # of Requests
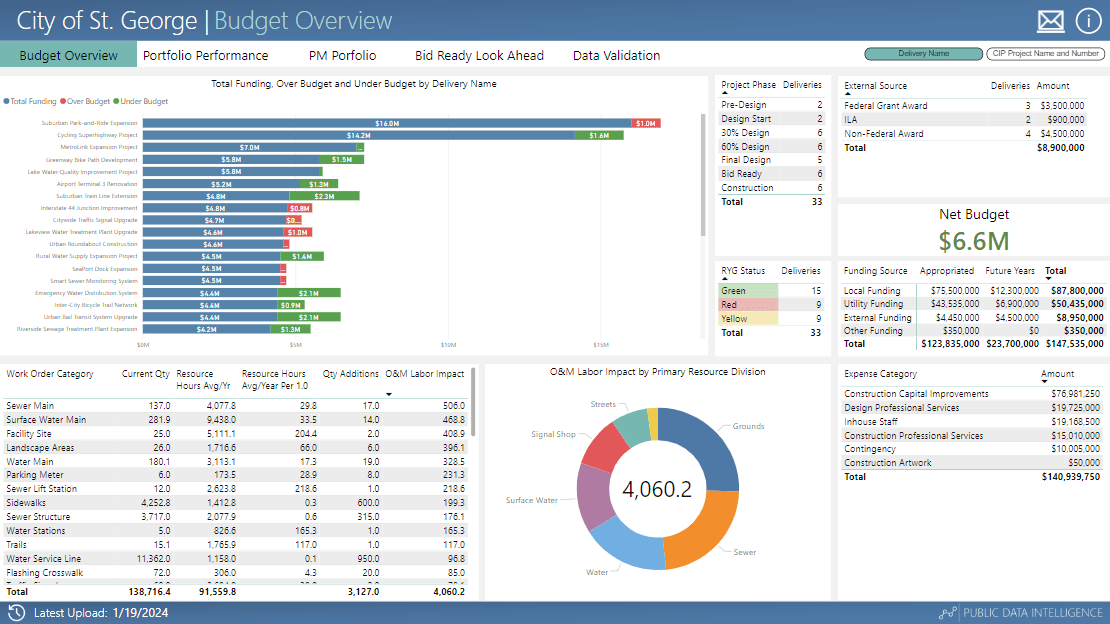
Capital Projects
Summary
Our Power BI report for capital projects is a valuable tool for city managers, planners, and stakeholders who want to monitor and evaluate the progress and performance of various public works. The report provides a comprehensive overview of the current status, budget, timeline, and impact of each capital project.
Target Users
- Public Works Directors
- Finance Directors & Support Staff
- CIP Leadership & Management
- Project Engineers & Managers
Key Performance Indicators
- Scope
- Schedule
- Budget
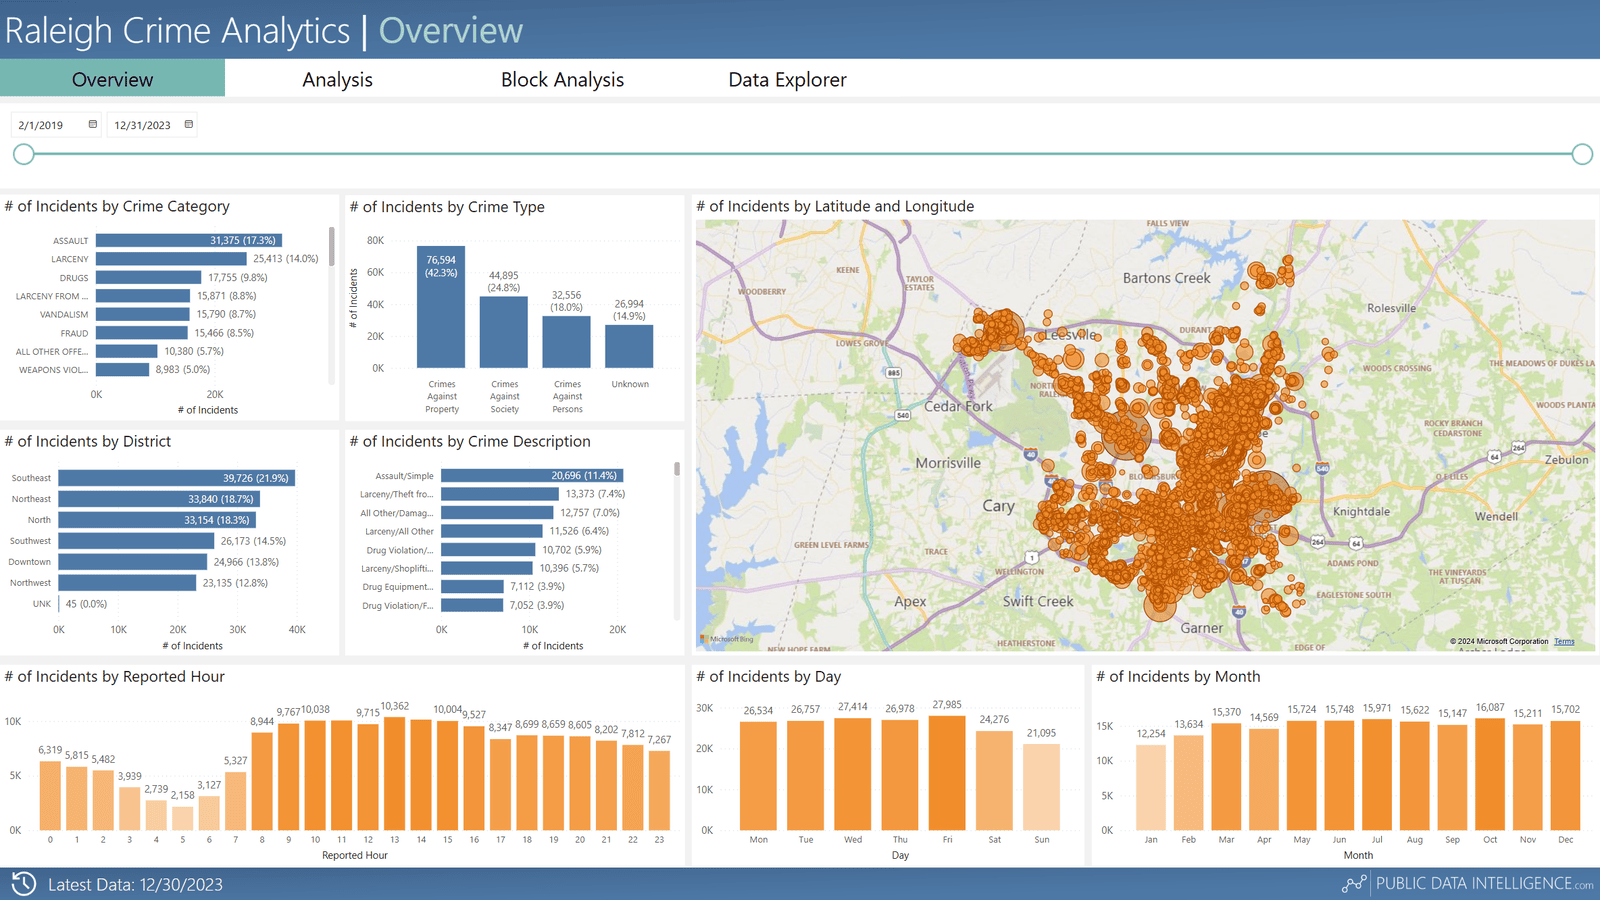
Police Incidents
Summary
Our Power BI report for police incidents helps you monitor and analyze key metrics related to incident locations, times of day, and response times. It features dynamic mapping and allows you to filter and drill down by incident type, district, and more, providing valuable insights to enhance police response strategies.
Target Users
- Police Chiefs
- Public Safety Analytics
- Emergency Response Coordinators
- City Planners
Key Performance Indicators
- Incident Locations
- Time of Day
- Incident Type
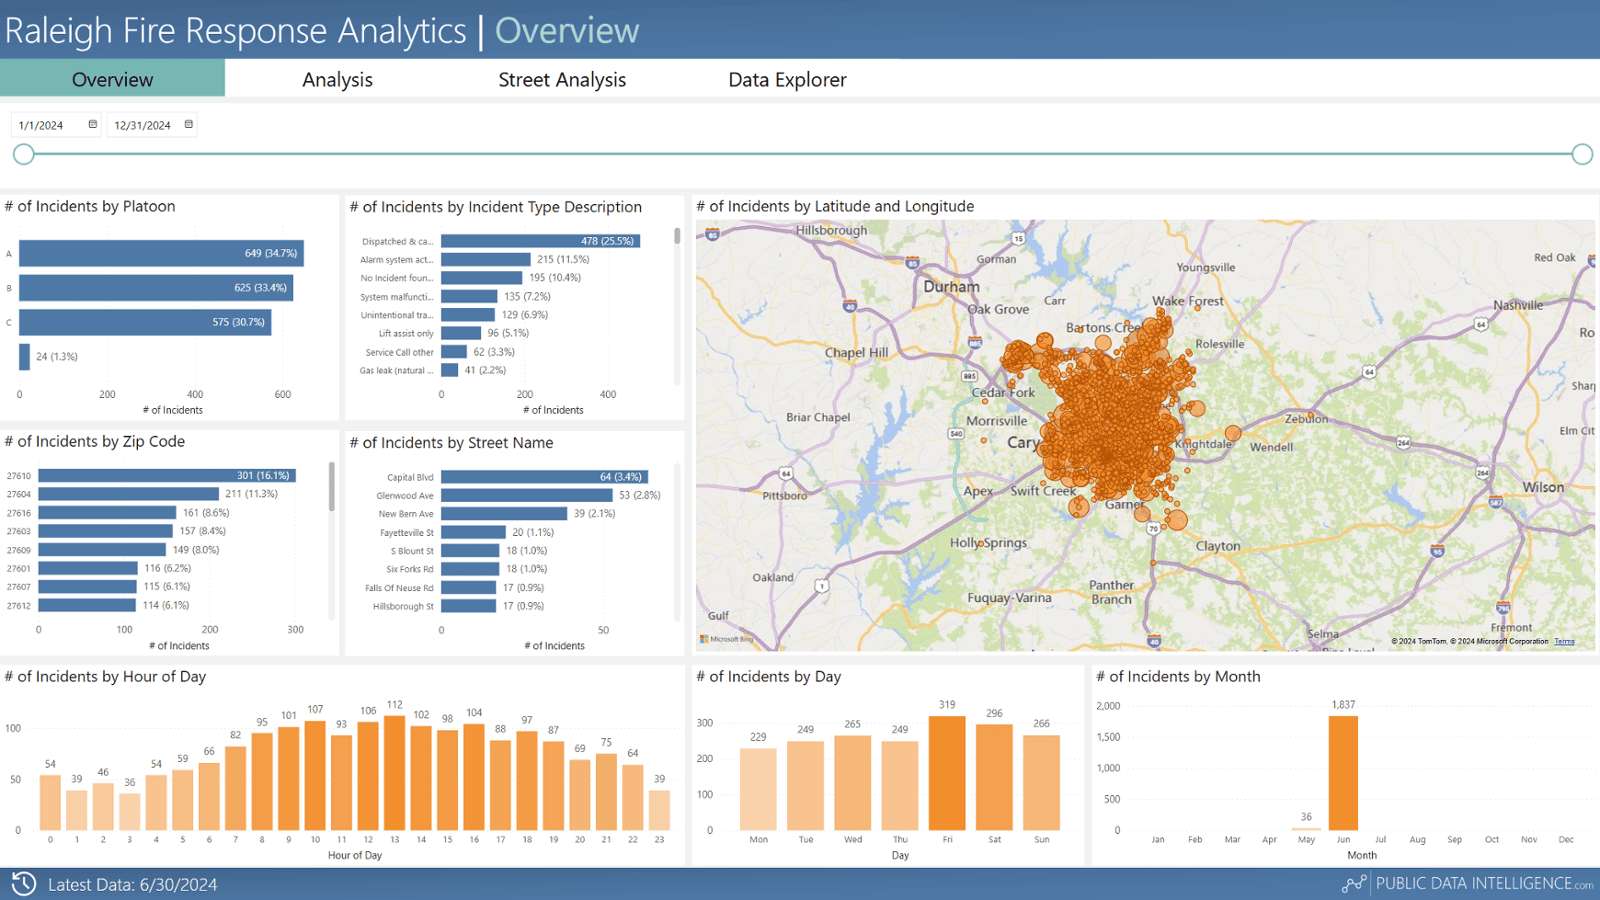
Fire Responses
Summary
Our Power BI report for fire incidents visualizes key metrics such as incident locations, response times, average on-scene time, and total incident duration. With dynamic mapping and filtering options, it offers insights to optimize fire department performance and response efficiency.
Target Users
- Fire Chiefs
- Public Safety Analytics
- Emergency Response Coordinators
- City Planners
Key Performance Indicators
- Incident Locations
- Time of Day
- Incident Type
- Average On-Scene, Response, and Incident Times